The 3 AM Phone Call Nobody Wants
It's 3:17 AM. Your phone rings. It's the on-call engineer for your bank's fraud detection system.
"The model's been rejecting legitimate transactions for the past four hours. Customer support is getting hammered. How many false positives did we generate? When did this start? What changed?"
You open your laptop, still half-asleep. You check the logs. They're scattered across five different systems. You check the model's accuracy metrics. Last updated: three days ago. You check when the model was last deployed. There's no timestamp. You check what data it's been seeing. That information... doesn't exist.
By the time you piece together what happened, it's 6 AM. Customers are furious. Your boss wants a full incident report by 9 AM. And the worst part? You still don't know exactly when the problem started or what triggered it.
This scenario plays out constantly in BFSI. According to recent industry data, traditional rule-based monitoring systems generate up to 90% false positives, and when things go wrong, teams waste hours—sometimes days—trying to reconstruct what happened.
Here's what I've learned building monitoring systems for ML models in regulated environments: You need three types of visibility working together:
Metrics (the numbers): Model accuracy, latency, prediction counts
Logs (the events): What happened, when, and why
Dashboards (the story): How everything connects, visualized for humans
The Prometheus + Loki + Grafana stack (often called PLG) gives you all three. More importantly, it gives you something regulators increasingly demand: complete, auditable records of your model's behavior over time.
Today, I'm walking you through why this stack matters for BFSI, how the pieces fit together, and what a production implementation actually looks like—without drowning you in configuration files.
What This Stack Actually Does (And Why Banks Care)
The Big Picture: Your Model's Flight Recorder
Think of this stack like an aircraft's flight data recorder (the "black box"). When a plane crashes, investigators can reconstruct exactly what happened because every critical system—altitude, speed, engine temperature—was continuously recorded.
Your ML model needs the same thing. When it "crashes" (performance degrades, bias emerges, or predictions go haywire), you need to reconstruct exactly what happened. Not approximately. Exactly.
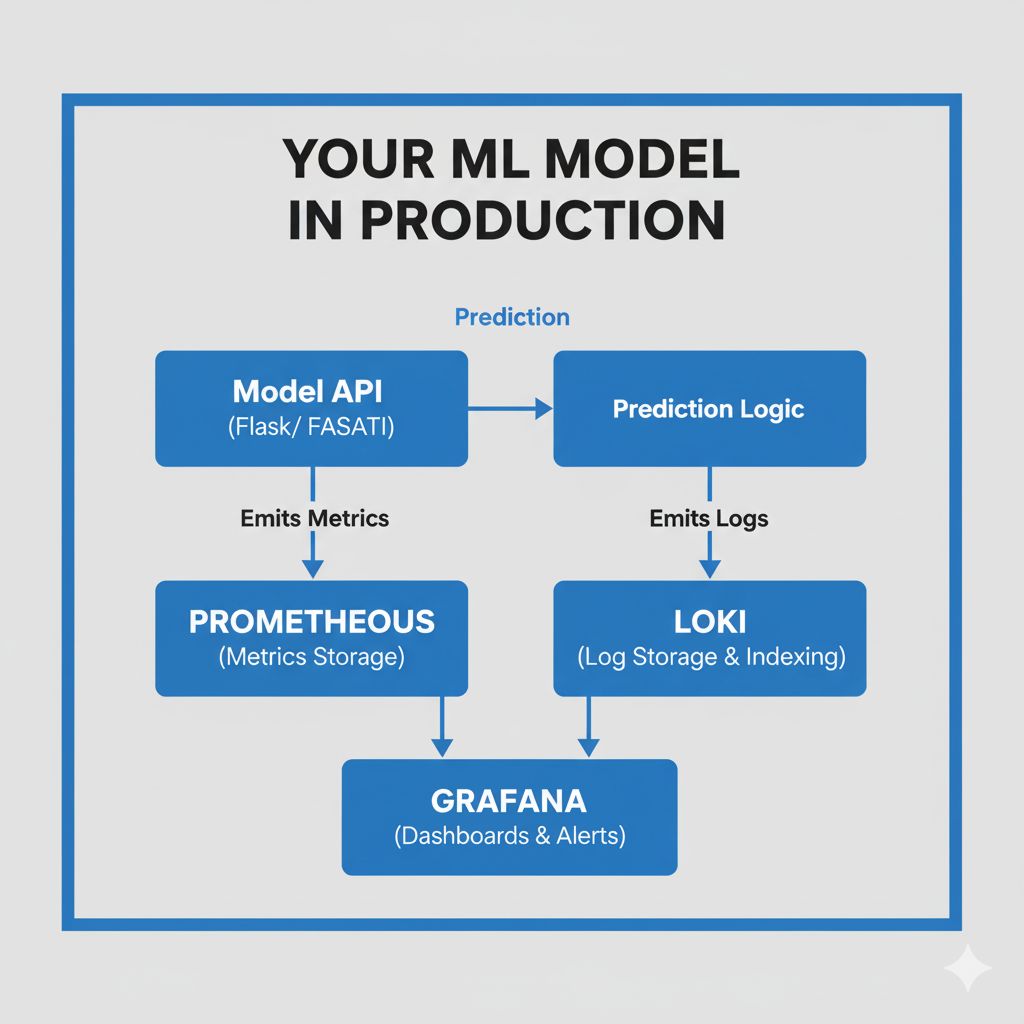
Here's how the three components work together:
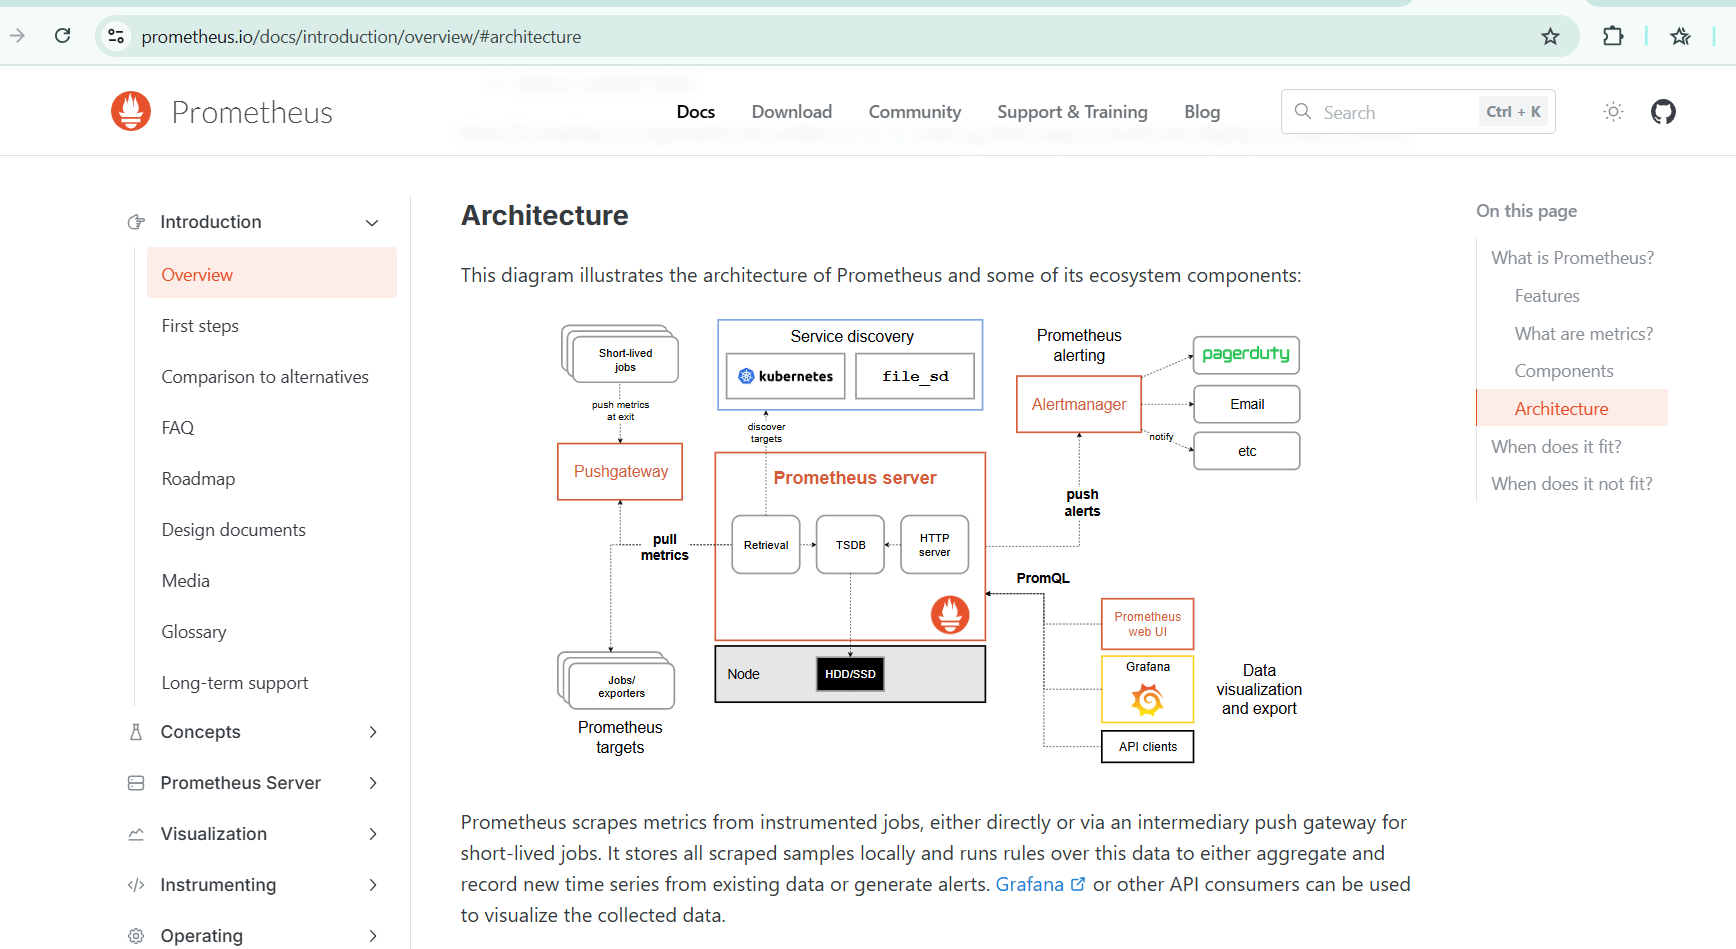
Prometheus = The Metrics Collector
Continuously scrapes numerical data (think: model accuracy, prediction counts, latency)
Stores this data as time-series (value + timestamp)
Answers questions like: "What was the model's precision at 2:15 PM yesterday?"
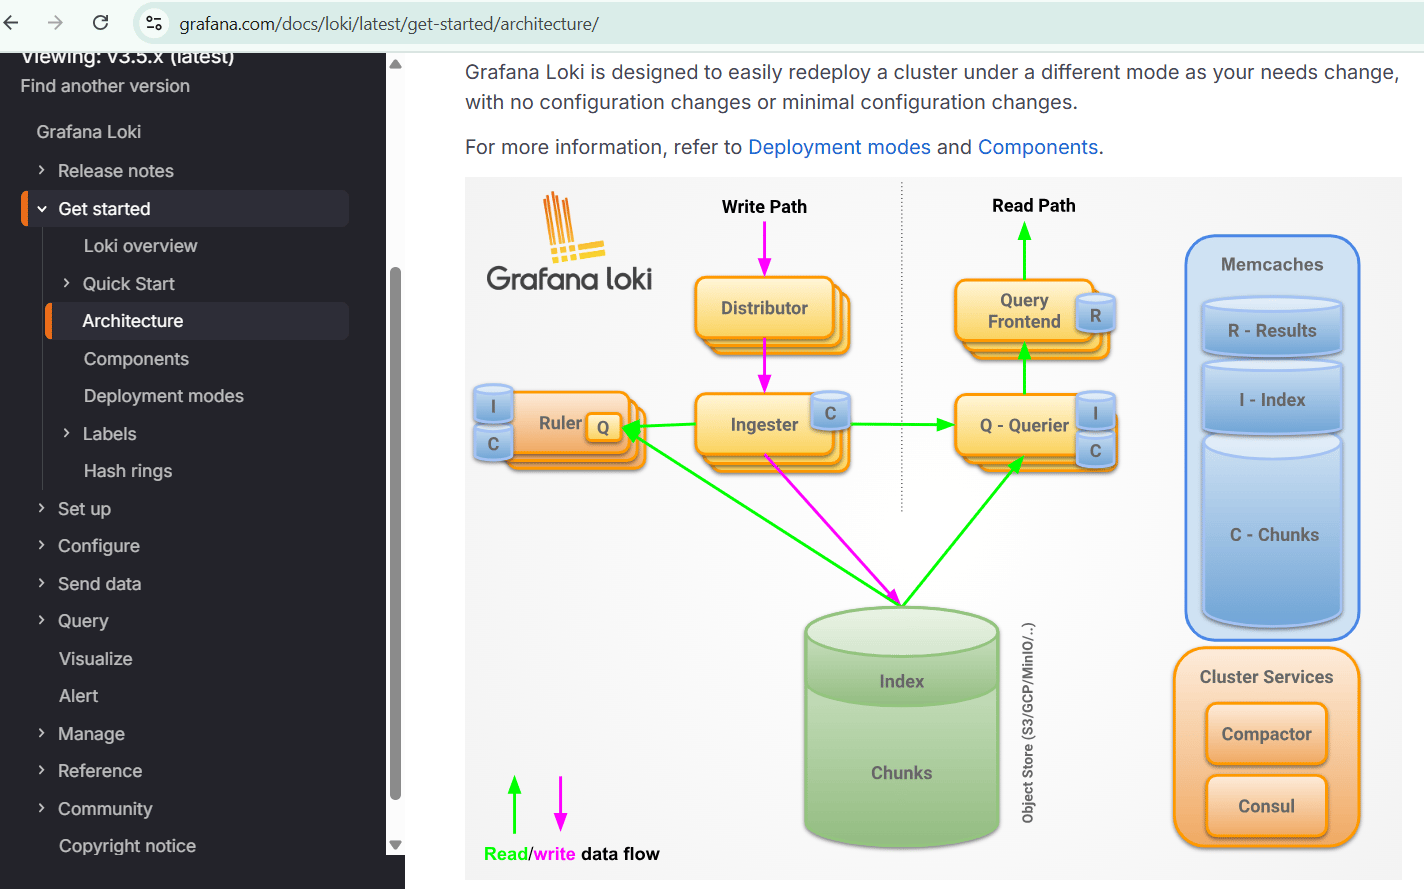
Loki = The Log Aggregator
Collects text logs from your application (think: "Model rejected transaction ID 47239, reason: anomaly score 0.91")
Indexes by metadata, not full text (making it cheap to run at scale)
Answers questions like: "Show me all high-confidence fraud predictions in the last hour"
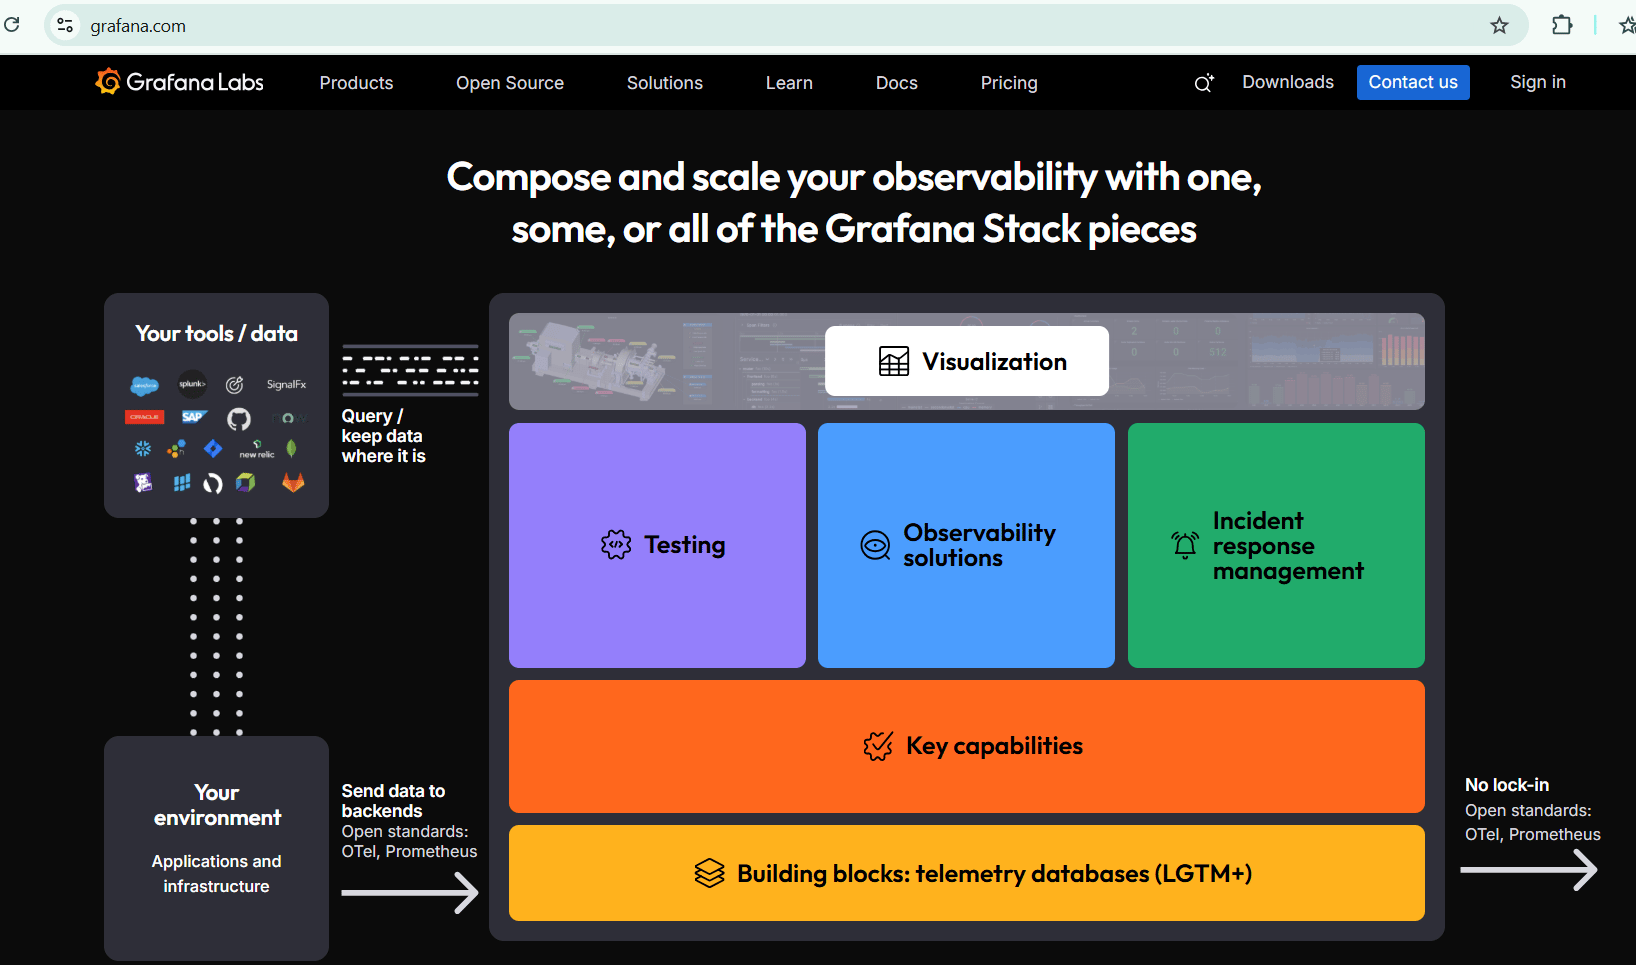
Grafana = The Dashboard & Alerting Hub
Visualizes data from both Prometheus and Loki
Creates dashboards that make sense to humans (and regulators)
Sends alerts when things go wrong
Answers questions like: "Is our model healthy right now?"
Grafana
Why BFSI Needs This (The Regulatory Angle)
In consumer tech, monitoring is a nice-to-have. In banking, it's a must-have for three reasons:
1. Regulatory Requirements
Recent guidance from financial regulators emphasizes continuous monitoring of AI systems:
Fed guidance requires banks to validate and monitor models continuously
European AI rules (effective 2026) mandate automatic logging throughout AI system lifecycles
AI-driven systems must demonstrate they can detect and respond to performance degradation
Without proper monitoring, you can't prove to regulators that your model is behaving correctly.
2. Incident Response
When something goes wrong—and it will—your response time matters:
Average time to detect ML model issues without monitoring: 48-72 hours
Average time to detect with proper monitoring: 5-15 minutes
Difference in customer impact: Massive
3. Audit Trails
Regulators ask questions like:
"On March 15th, why did your model reject customer #47239's loan?"
"Can you show me the model's performance over the past quarter?"
"When did you first detect the fairness issue we're discussing?"
If you can't answer these questions with data—immediately—you're in trouble.
How It Works: The Three-Layer Monitoring Architecture
Let me break down how each component actually functions in a production environment.
Layer 1: Prometheus – Time-Series Metrics That Tell the Story
Prometheus is a pull-based monitoring system. Instead of your application pushing metrics to Prometheus, Prometheus periodically "scrapes" (pulls) metrics from your application.
What metrics should you track? In BFSI ML systems, focus on these categories:
Model Performance Metrics:
Prediction accuracy (overall and by segment)
Precision and recall rates
Confidence score distributions
False positive/negative rates
Operational Metrics:
Predictions per second
Model inference latency (P50, P95, P99)
API response times
Error rates
Business Metrics:
Total approvals vs. rejections
High-confidence predictions (above threshold)
Flagged transactions requiring human review
How Prometheus stores this: Time-series format
# Example: Model accuracy over time
model_accuracy{model="fraud_v2", environment="prod"} 0.94 @1704038400
model_accuracy{model="fraud_v2", environment="prod"} 0.93 @1704038460
model_accuracy{model="fraud_v2", environment="prod"} 0.89 @1704038520
Each data point has:
Metric name (
model_accuracy)Labels for filtering (
model="fraud_v2")Value (
0.94,0.93,0.89)Timestamp (when it was recorded)
The power of this: You can query "Show me model accuracy for the fraud model in the last 24 hours" and get an instant graph. You can also set alerts: "If accuracy drops below 0.85, send me a Slack message immediately."
Layer 2: Loki – Structured Logs for Debugging
While Prometheus tracks the numbers, Loki tracks the events. Every prediction your model makes generates a log line. Every error generates a log line. Every user action generates a log line.
What Loki does differently:
Traditional log systems (like Elasticsearch) index every word in every log message. This is powerful but expensive—especially at the scale banks operate (millions of transactions daily).
Loki only indexes labels (metadata), not the log content itself. This makes it:
10x cheaper to run at scale
Faster to query by common patterns
Compatible with Prometheus's label system
Example log structure:
# Traditional logging (unstructured)
2025-01-15 14:23:45 Model predicted fraud for transaction, confidence 0.91

# Loki-style logging (structured with labels)
timestamp="2025-01-15T14:23:45Z"
level="info"
model="fraud_v2"
transaction_id="47239"
prediction="fraud"
confidence="0.91"
user_segment="high_value"
msg="Prediction completed"
With structured logs, you can query:
"Show me all predictions where confidence > 0.9 in the last hour"
"Find all errors from model fraud_v2 today"
"Give me logs for transaction #47239"
Why this matters for audits: When a regulator asks "Why did you reject this specific loan application?", you can pull the exact log showing:
What data the model received
What prediction it made
What confidence score it assigned
What decision rule triggered the rejection
Layer 3: Grafana – Making Data Human-Readable
Prometheus and Loki store data. Grafana makes it understandable.
Three core functions:
1. Dashboards
Grafana creates visual dashboards showing:
Real-time model health metrics
Trends over time (is accuracy improving or degrading?)
Comparisons (model v1 vs. model v2 performance)
Business impact (how many approvals, rejections, escalations)
For BFSI, you typically need three dashboard types:
Operations Dashboard (for ML engineers):
Current model accuracy, latency, error rates
Prediction volume by hour
Infrastructure health (CPU, memory)
Business Dashboard (for product managers and risk teams):
Approval/rejection rates
Average confidence scores
High-risk transactions flagged for review
Business metrics (revenue impact, customer satisfaction)
Compliance Dashboard (for auditors and regulators):
Model performance over time (proving continuous validation)
Fairness metrics by demographic segment
Complete audit trail of model changes
Alert history (what issues were detected and when)
2. Alerting
Grafana watches your metrics and sends alerts when thresholds are crossed:
Alert: Model Accuracy Drop
Condition: IF model_accuracy < 0.85 FOR 10 minutes
Action: Send Slack message to #ml-ops-alerts
         Create PagerDuty incident
         Log alert to audit trail
3. Correlation
The real power: Grafana can show metrics and logs side-by-side. When accuracy drops at 2:15 PM, you can immediately pull logs from that time period to see what changed.
The BFSI Implementation Pattern (What Actually Works)
Let me show you how this looks in practice, using a fraud detection model as the example.
Setup Overview: What You're Building
You're creating a monitoring stack that:
Instruments your model API to emit metrics and logs
Runs Prometheus to scrape and store metrics
Runs Loki to aggregate logs
Runs Grafana to visualize everything
Sets up alerts for critical thresholds
Deployment approach: Most banks run this stack on Kubernetes, but you can also use Docker Compose for simpler setups or managed services (AWS, Azure, GCP all offer these tools as managed services).
Step 1: Instrumenting Your Model API
Your ML model (probably served via Flask, FastAPI, or similar) needs to expose metrics and emit structured logs.
For metrics, use the Prometheus Python client:
from prometheus_client import Counter, Histogram, Gauge
import time

# Define metrics
predictions_total = Counter(
    'model_predictions_total',
    'Total predictions made',
    ['model_version', 'prediction_class']
)

prediction_confidence = Histogram(
    'model_prediction_confidence',
    'Confidence scores of predictions',
    ['model_version']
)

model_accuracy = Gauge(
    'model_accuracy_current',
    'Current model accuracy',
    ['model_version']
)

# In your prediction endpoint:
def predict(transaction_data):
    start_time = time.time()

    # Make prediction
    prediction, confidence = model.predict(transaction_data)

    # Record metrics
    predictions_total.labels(
        model_version='fraud_v2',
        prediction_class=prediction
    ).inc()

    prediction_confidence.labels(model_version='fraud_v2').observe(confidence)

    return prediction, confidence
For logs, use structured logging:
import structlog
import logging

# Configure structured logging
structlog.configure(
    processors=[
        structlog.processors.TimeStamper(fmt="iso"),
        structlog.processors.JSONRenderer()
    ]
)

log = structlog.get_logger()

# In your prediction endpoint:
def predict(transaction_data):
    prediction, confidence = model.predict(transaction_data)

    # Emit structured log
    log.info("prediction_made",
        model_version="fraud_v2",
        transaction_id=transaction_data['id'],
        prediction=prediction,
        confidence=float(confidence),
        amount=transaction_data['amount'],
        merchant_category=transaction_data['category']
    )

    return prediction, confidence
That's it for instrumentation. Your model now emits metrics Prometheus can scrape and logs Loki can index.
Step 2: Deploying the Stack (Simplified)
I won't dump a 200-line Docker Compose file on you. Here's the conceptual setup:
Prometheus configuration tells it where to scrape metrics from:
# prometheus.yml
scrape_configs:
  - job_name: 'fraud-model'
    scrape_interval: 15s  # Check every 15 seconds
    static_configs:
      - targets: ['model-api:8000']  # Your model's /metrics endpoint
Loki configuration tells it how to store logs:
# loki-config.yml
server:
  http_listen_port: 3100

ingester:
  lifecycler:
    ring:
      kvstore:
        store: inmemory
      replication_factor: 1
Grafana configuration connects to both data sources:
Add Prometheus as a data source (URL:
http://prometheus:9090)Add Loki as a data source (URL:
http://loki:3100)
Step 3: Building Your First Dashboard
Here's where it gets practical. Let's build an "ML Model Health" dashboard that shows:
Panel 1: Model Accuracy Over Time
Data source: Prometheus
Query:
model_accuracy_current{model_version="fraud_v2"}Visualization: Time series line graph
Purpose: See if accuracy is stable, improving, or degrading
Panel 2: Prediction Volume
Data source: Prometheus
Query:
rate(model_predictions_total[5m])Visualization: Graph showing predictions per second
Purpose: Detect traffic spikes or unusual quiet periods
Panel 3: Confidence Score Distribution
Data source: Prometheus
Query:
histogram_quantile(0.95, model_prediction_confidence)Visualization: Heatmap or histogram
Purpose: Ensure model isn't just guessing (all predictions near 0.5) or overconfident
Panel 4: Recent High-Confidence Predictions
Data source: Loki
Query:
{job="fraud-model"} | json | confidence > 0.9Visualization: Log panel
Purpose: Show specific high-stakes predictions for review
Panel 5: Error Log Stream
Data source: Loki
Query:
{job="fraud-model"} | json | level="error"Visualization: Log panel (live tail)
Purpose: Catch issues immediately
Step 4: Setting Up Audit-Ready Alerts
These are the alerts that actually matter in BFSI:
Alert 1: Accuracy Degradation
Condition: model_accuracy_current < 0.85 for 15 minutes
Severity: CRITICAL
Action:
  - Slack #ml-ops-critical
  - PagerDuty incident
  - Log to compliance audit trail
Message: "Fraud model accuracy dropped to {value}. Investigate immediately."
Alert 2: Unusual Prediction Pattern
Condition: rate(model_predictions_total{prediction="fraud"}[1h]) > 2x normal
Severity: WARNING
Action:
  - Slack #ml-ops-alerts
Message: "Fraud predictions spiked {value}% above baseline. Possible data drift or attack."
Alert 3: Model Latency Spike
Condition: histogram_quantile(0.95, model_latency) > 2 seconds
Severity: HIGH
Action:
  - Slack #ml-ops-alerts
  - Create Jira ticket
Message: "Model P95 latency exceeds SLA. Check infrastructure."
What Makes This "Audit-Ready"
Regulators care about three things:
1. Complete Records
With this stack, you can answer:
"Show me every prediction the model made on March 15th between 2 PM and 4 PM" ✅
"What was the model's accuracy on the first Tuesday of each month for the past year?" ✅
"Give me logs for the 100 transactions with highest fraud scores last week" ✅
2. Incident Detection & Response
You can demonstrate:
"We detected the performance issue within 10 minutes of it starting" ✅
"Here's the alert that fired and who responded" ✅
"Here's the timeline of our remediation actions" ✅
3. Continuous Validation
You can prove:
"We monitor model performance 24/7 with these specific metrics" ✅
"We have automated alerts for performance degradation" ✅
"We review model health dashboards weekly (here are the screenshots)" ✅
Example audit scenario:
Regulator: "In Q2 2024, your model denied 15% more loan applications than Q1. Why?"
You (opens Grafana dashboard): "Here's our model accuracy over that period—it remained stable at 92%. Here's the approval rate by credit score band—we saw a 23% increase in applications from subprime borrowers. Here's our confidence score distribution—the model was more certain in Q2, suggesting clearer signal in the data. Here's the fairness analysis—approval rates remained consistent across demographics."
Regulator: "Can you recreate the decision for application #47239 from March 15th?"
You (queries Loki logs): "Yes. Here's the log showing input features, model prediction (rejected, 87% confidence), and the specific risk factors that contributed: DTI ratio 52%, recent missed payment, 3 hard credit inquiries in 30 days."
This is what "audit-ready" means—immediate answers backed by data.
Common Mistakes (And How to Avoid Them)
From watching teams implement this stack in BFSI environments:
Mistake 1: Treating Monitoring as an Afterthought
Many teams build the model, deploy it, then think "oh, we should probably monitor this." By then, you've already lost days or weeks of baseline data.
Fix: Build monitoring into your model from day one. Your model API should emit metrics and logs from the first line of code you write.
Mistake 2: Monitoring Too Much (Alert Fatigue)
Teams instrument everything, create 50 alerts, and then... ignore them all because they fire constantly.
Fix: Start with 3-5 critical alerts:
Model accuracy below threshold
Prediction latency above SLA
Error rate spike
Unusual prediction distribution
Add more alerts only when you have a specific reason.
Mistake 3: Logs Without Structure
Unstructured logs like "Model made prediction" are useless. You can't query them, filter them, or aggregate them.
Fix: Always use structured logging with key-value pairs. Make transaction IDs, model versions, and confidence scores queryable fields.
Mistake 4: No Retention Policy
Prometheus and Loki can accumulate massive amounts of data. Without a retention policy, you'll run out of disk space.
Fix: For BFSI, typical retention:
High-resolution metrics: 30 days (for operational debugging)
Downsampled metrics: 2 years (for trend analysis)
Logs: 90 days to 1 year (for audit compliance)
Regulators may require longer retention for certain data—check your specific requirements.
Mistake 5: Monitoring in Isolation
Your monitoring stack runs separately from your model. When the monitoring system goes down, you don't know the model is broken.
Fix: Monitor the monitoring system. Set up Grafana Cloud or a separate alerting system to ping your stack every 5 minutes. If it doesn't respond, you get alerted.
What Regulators Are Actually Looking For (Translation Guide)
When discussing your monitoring setup with Compliance or Risk teams, frame it this way:
Instead of: "We use Prometheus to scrape time-series metrics."
Say: "We have automated performance monitoring that checks the model's accuracy every 15 seconds and alerts us immediately if it drops below acceptable levels. This ensures we catch issues before they impact customers."
Instead of: "Loki indexes log labels for fast queries."
Say: "We maintain complete audit trails of every prediction the model makes, with structured records showing input data, decision rationale, and confidence scores. We can reproduce any historical decision within minutes."
Instead of: "Grafana provides observability dashboards."
Say: "We have real-time dashboards that Risk and Compliance teams can access to verify the model is performing correctly. These dashboards show fairness metrics, accuracy trends, and business impact—everything needed for ongoing validation."
Looking Ahead: 2026-2030
Here's where monitoring is heading in BFSI:
2026: Automated Drift Detection
Current state: You set manual thresholds for alerts (accuracy < 85%).
Future state: AI-powered monitoring that learns normal patterns and automatically detects anomalies. If your fraud model's accuracy normally varies between 90-94%, the system alerts when it hits 89%—even though that's still "good" in absolute terms.
2027: Real-Time Compliance Reporting
Current state: Quarterly compliance reports generated manually from dashboard data.
Future state: Automated compliance reports generated continuously. Every regulator query answered with real-time dashboard links. "What's your model's current fairness across demographics?" → Instant dashboard showing live data.
2028: Predictive Monitoring
Current state: Reactive monitoring—alert fires after problem starts.
Future state: Predictive monitoring—system detects early warning signs and alerts before problems materialize. "Data distribution is shifting in a way that historically precedes drift. Consider retraining."
2029-2030: Unified ML Observability
Current state: Separate monitoring for different models, stitched together manually.
Future state: Enterprise ML observability platforms that monitor hundreds of models holistically, detect cross-model patterns, and provide unified compliance views. "Show me fairness metrics across all credit decisioning models in the organization."
What to do now:
Build monitoring into every new model from day one
Standardize on a single stack (PLG or similar) across your organization
Create reusable dashboard templates for common use cases
Train your ML engineers to think "monitoring first, not monitoring later"
HIVE Summary
Monitoring isn't optional in BFSI—it's a regulatory requirement. You must be able to demonstrate continuous validation and create complete audit trails of model behavior.
The PLG stack (Prometheus + Loki + Grafana) gives you three critical capabilities: metrics for numbers, logs for events, and dashboards for human understanding. Together, they create the "flight recorder" your ML systems need.
Instrument early, not late—build metrics and structured logging into your model from the first day. Retrofitting monitoring onto existing systems is 10x harder than building it in from the start.
Start simple, expand thoughtfully—begin with 3-5 critical alerts (accuracy, latency, errors), then add more as you learn what actually matters for your specific models and business context.
Start here:
If you're building a new ML system: Add Prometheus metrics and structured logging to your model API before you write any ML code. Deploy PLG stack in your dev environment so you're practicing monitoring from day one.
If you have models in production without monitoring: Pick your highest-risk model and instrument it this week. Start with just accuracy and prediction count metrics. Add logs next week. Build dashboards the week after. Don't try to do everything at once.
If you're building an ML platform: Make PLG stack part of your standard deployment template. Every model that goes through your platform should automatically get monitoring. Make it impossible to deploy unmonitored models.
Looking ahead (2026-2030):
Monitoring will shift from reactive (alert after problem) to predictive (alert before problem) using AI-powered anomaly detection
Regulatory requirements will get stricter—expect mandates for specific monitoring metrics and retention periods
ML observability will become a specialized skill—engineers who understand both ML and production monitoring will be in high demand
The banks that invested in monitoring infrastructure today will deploy models 10x faster in 2028 because they won't be scrambling to retrofit compliance
Open questions we're all figuring out:
How long should we retain high-resolution monitoring data in BFSI? Regulations aren't clear yet, and storage costs add up fast.
What's the right balance between automated alerting and alert fatigue? Too few alerts = missed issues. Too many = ignored alerts.
How do we monitor generative AI models where "accuracy" isn't well-defined? Traditional metrics don't work when outputs are creative text.
Jargon Buster
Prometheus: An open-source time-series database that stores numerical metrics (like model accuracy or latency) along with timestamps. It "scrapes" (pulls) metrics from your applications periodically instead of requiring apps to push metrics to it.
Loki: A log aggregation system that stores text logs from applications. Unlike traditional systems that index every word, Loki only indexes metadata (labels), making it much cheaper to run at scale. Built by the same team as Grafana.
Grafana: An open-source dashboard and alerting platform that visualizes data from Prometheus, Loki, and other sources. Think of it as the "front-end" that makes monitoring data human-readable.
Time-Series Data: Data points collected over time, where each point has a timestamp. Example: model accuracy was 0.94 at 2:00 PM, 0.93 at 2:15 PM, 0.92 at 2:30 PM. Perfect for tracking trends and detecting changes.
Scraping: Prometheus's method of collecting metrics—it actively requests data from your application's /metrics endpoint every few seconds (typically 15-60 seconds). This is the opposite of "push-based" systems where applications send metrics proactively.
Structured Logging: Logs formatted as key-value pairs (JSON or similar) instead of plain text. Makes logs searchable and filterable. Example: {"level":"error", "model":"fraud_v2", "transaction_id":"47239"} vs plain text "Error in fraud model for transaction 47239".
Labels: Metadata tags attached to metrics and logs that allow filtering. Example: model_version="fraud_v2" lets you filter metrics to only show data from that specific model version. Critical for managing multiple models.
Retention Policy: How long you keep monitoring data before deleting it. Driven by two factors: storage costs (data accumulates fast) and regulatory requirements (financial institutions often must retain records for years).
Fun Facts
On Monitoring Costs at Scale: A large US bank discovered their monitoring costs were exceeding their ML model compute costs. The culprit? They were logging every single prediction (12 million daily) with full input features. After switching to structured logging that captured only decision-critical fields plus sampling (log 100% of high-confidence fraud predictions, 1% of routine ones), they cut logging costs by 87% while maintaining full audit compliance. The lesson: Smart sampling is your friend in production.
On Alert Tuning Reality: When JPMorgan Chase implemented ML monitoring across their fraud models, their initial alert configuration fired 340 alerts in the first week. By week four, the on-call team was ignoring 90% of alerts. They spent three months tuning thresholds by working backward from actual incidents: "What metric would have caught this issue 30 minutes earlier?" Their final alert set: 8 critical alerts that fire ~twice per month and get 100% response rate. Quality over quantity wins.
For Further Reading
Prometheus Best Practices for ML Monitoring (Prometheus Docs, 2025)
https://prometheus.io/docs/practices/
Official guide on metric design, labeling strategies, and query optimization—applies directly to ML systemsGrafana Labs: Observability for Financial Services (Grafana, 2024)
https://grafana.com/solutions/financial-services/
Real-world patterns from banks using Grafana, including compliance dashboard templatesGoogle: ML Monitoring Best Practices (Google Cloud, 2024)
https://cloud.google.com/architecture/mlops-continuous-delivery-and-automation-pipelines-in-machine-learning
Comprehensive guide covering monitoring as part of MLOps maturity—applicable regardless of cloud providerAWS: Monitoring Machine Learning Models (AWS SageMaker Docs, 2025)
https://docs.aws.amazon.com/sagemaker/latest/dg/model-monitor.html
Practical patterns for production ML monitoring, including drift detection approachesBIS Working Paper: AI Model Risk Management (Bank for International Settlements, 2024)
https://www.bis.org/publ/work1089.htm
Central bank perspective on monitoring requirements for AI in finance—useful for understanding regulator mindset
Next week in Tools Series: We're diving into LangChain + Postgres Vector Retrieval Pipeline—building compliant retrieval workflows for KYC and claims processing. You'll see how to architect RAG systems that meet BFSI's data governance requirements while delivering fast, accurate results.
This is part of our ongoing work understanding AI deployment in financial systems. If your monitoring setup looks different, I'd love to hear what's working (or not working) in your environment.
— Sanjeev @AITECHHIVE
